Understanding the Patient Pattern Management Page
Note: Your Staff Manager configuration may not include this optional application. To add this application to your configuration, contact your Clinical Consultant or Client Advocate.
The Patient Pattern Management page allows you to see at a glance where patients are in their progress patterns. The page itself is divided into two sections: the Navigation Pane and the Pattern Display pane.
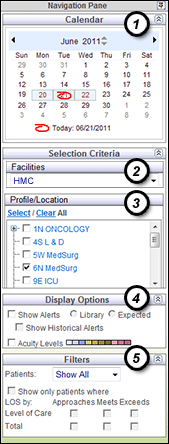
The selections you make on the Navigation Pane do not go into effect until you click Go. The Navigation Pane includes the following sections.

|
- Calendar: Selecting a date with the calendar displays patient pattern information for the selected day and the days before and after.
- (Optional) Selection Criteria: Facilities: This menu is displayed only when organizations have multiple facilities. You select a facility to populate the Profile/Location menu.
- Selection Criteria: Profile/Location: You select profiles and locations by selecting their check boxes. To select or clear all profile check boxes, click the desired link under Select/Clear All. To be displayed in the Patient Pattern Management page Profile/Location menu, the profile must be mapped as a location in Staff Manager Administrator and must have HL7 Enabled checked on the Staff Manager Administrator Workload tab.
- Display Options: You can display Alerts, Acuity Levels, or both.
- The Length of Stay (LOS) alerts allow you to refine the selection options of Show Current patients or Show All patients in the Filters section (see Filters following). You can show Level of Care and TLOS alerts based on Library patterns or Expected patterns. If you select Library patterns, you also have the option to Show Historical Alerts, which lets you see what alerts were displayed in past level of care groups for the patient. If you display alerts, the LOS Alerts Legend is displayed under the patient pattern bars in the Pattern Display pane.

See Patient Pattern Alerts for more detailed information about alerts. - Selecting Acuity Levels displays the Acuity color code legend and the patient pattern bars colored by their corresponding acuity level values.
- Filters: There are two filters, the Patients filter and the Alerts filter.
Patients: Show Current is the default selection when the current date is in view. This displays all patterns for patients without a processed departure event as of the current time. Show All displays all patterns for patients in any of the selected profiles or locations at any time within the selected three day view. Alerts: This filter limits the number of patients shown based on their current LOS alert status by Level of Care, Total, or both. For each LOS option, you can limit patients to those who are approaching, meeting, or exceeding the selected LOS at the current moment (that is, the time you made your selections and clicked GO). The patient list is filtered based on the alert status compared to the Library or Expected pattern, as selected in the Display Options. For more detailed information about alerts, see Patient Pattern Alerts.
|
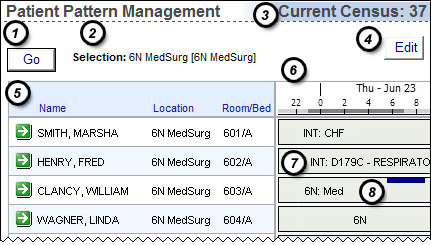
The following illustration shows the Pattern Display pane for an Intermediate Level of Care unit. The Pattern Display pane contains the following sections.

- Go button: Clicking Go puts your Navigation Pane selections into effect.
- Selections: The page lists selected LOS Filter, Alerts, profiles and locations beside the Go button using the format LOS Filter : Level of Care [Meets], Alerts: Expected and Profiles [Locations]. If the selections are too long to display, the page displays a shortened list followed by three periods, as in LOS Filter: Level of Care [Meets], Alerts: Expected, 6Med-Surg [6N, 6S...]. If you position your pointer over the selections, however, a tooltip displays the full list.
- Current Census: The census for the current date and time. In the preceding illustration, the current census is 40. Clairvia Web updates the census when you refresh the page. If you select multiple profiles, the Current Census is the total for those profiles. For example, assume you select two profiles. One profile has a census of 20; the other has a census of 14. The page displays a Current Census value of 34, the sum of 20 plus 14.
- Edit button: Clicking Edit opens the Administer Patient Pattern window, where you can update a patient's pattern, departure date, discharge date, and so on. See Using the Administer Patient Pattern Window for more information.
- Patient Details: On the left side of the patient pattern graph, the header bar lists the columns Name, Location, and Room/Bed. To sort the data by any of these columns, click the column header. The default sort is ascending order by Room/Bed. The page displays data by patient in a Last Name, First Name format with the associated location, room, and bed. If the name exceeds the maximum allowed space, the page displays … as part of the name; however, the patient's full name can be seen by pointing the cursor at the name. To the left of each patient’s name is a green arrow button
 ; clicking the button opens the Patient Encounter Information window, where you can view the patient's event history, progress pattern, assessment history, and where you can manage other patient events.
- Timeline: The timeline displays the day of week, date, and hour currently on display. It also marks the length of shift category partitions in light and dark gray. If you select multiple locations spanning profiles, the timeline uses the default SCP of the first profile.

- Patient Pattern Bar Graphs: The page displays a bar graph for each patient. The bar represents the patient’s current pattern defined by DRG criteria and level of care, Non-DRG criteria and level of care, or Location and hospital service (if applicable), and acuity level (optional). If you set alerts to show, alerts display in the pattern bar for any patient in an alert state at NOW.
- Criteria-based patterns: The pattern bar for patients with DRG criteria-based patterns displays the letter D, the pattern abbreviation, the pattern description, and the level of care abbreviation for the patient’s current location, if the pattern is defined by levels of care. For example, a custom DRG pattern for DRG 195 would display as D195C - Simple Pneumonia & Pleurisy W/O CC/MCC. A patient in a Critical Care Level of Care group for pattern 652C, defined by a level of care, would have a bar labeled CC: D652C - Kidney Transplant. The label has an asterisk (*) if the pattern description exceeds the available space.
- Location-based patterns: The page labels each bar with the patient’s current and previous locations. For patterns with a location and a service, the label reads Location Abbreviation: Service Abbreviation. For example, a pattern for 6N Med-Surg and the Medical service would read 6N: MED. If the pattern does not have an assigned service, the bar label displays the location pattern abbreviation only. The label has an asterisk (*) if the pattern description exceeds the available space.
- Other Patient Event Bar: A navy blue bar in a patient's pattern bar graph displays an Other Patient Event. The length of the bar marks the duration of the event, with the start of the bar aligned to the start time of the event, and the end of the bar aligned to the end time. If event is ongoing, the page displays the Other Patient Event bar to the expected start time of the discharge event.

More Information about the Patient Pattern Bar Graphs
The data displayed in the patient pattern bar graphs gives you insight on each patient’s progress.
- A indicates an admission event.
- D indicates a departure event (for location-based patterns) or a hospital discharge event (for criteria-based patterns).
- S indicates an actual processed hospital service change transaction.
- A single black vertical line indicates an actual processed transfer event. The vertical line marks a transfer between locations or level of care groups.
- A black outline surrounds the patient pattern bars for your currently selected location (or facility) and the patients' locations and pattern description text are displayed in black text. If a patient's pattern includes time in another location (or facility), that section of the bar has a gray dashed outline and the location and pattern description text are displayed in gray text.
There is one case where the page may not show a patient’s bar graph: when there is an ADT record showing that the patient is in the location, but no pattern has been assigned. This can happen when restarting the Registration Import, since many events enter at the same time. It is a temporary condition; the patient’s pattern bar is displayed as soon as the interface processes the backlog of transactions.
In addition, Clairvia Web creates a virtual admission for each patient on each unit when first starting the HL7 census during Demand Manager implementation. This creates the patient lists without you having to wait for all patients to turnover.
Finally, pointing the cursor at a patient's pattern displays the following information.
- Patient Encounter Number (PEN)
- Medical Record Number (MRN)
- Admission Date
- Hospital Service
- Total Encounter Visits: How many admissions the patient has had under the current encounter number
The following illustrations show a user positioning the pointer to see more information about a patient.

Viewing Past and Future Data
When the page has the current date and time in the view, the patient pattern bars show past data in gray and projected data in white. The line between past and future data is the Now line, indicated by a blue arrow and dotted blue line down the length of the page. Historical data is to the left of the Now line; future data is to the right. The page positions the Now line based on the date and time you clicked Go or the time you last refreshed the page.
The Patient Pattern Management page provides the most up-to-date patient information each time you open it. Because patient data can change at any time, however, you should refresh the page if it has been open for a long time. To refresh the data, click the Internet Explorer refresh button, press the F5 key, or from the IE View menu, select Refresh.
Current Acuity Levels
In facilities using both Demand Manager and Outcomes-Driven Acuity, you can display current acuity levels on the Patient Pattern Management page. See Patient Pattern Management with Acuity Levels for more information.
 Related Topics


 Related Topics