The Acuity Summary Report
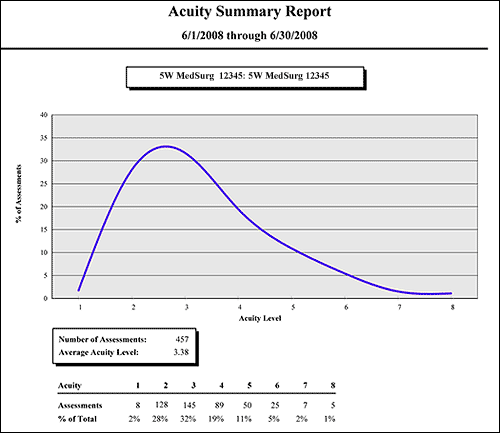
This report summarizes acuity activity for your selected profiles and all locations within them over a selected period. The report displays activity as:
- A graph charting the percent of patients at each acuity level
- The number of assessments made in the selected profile or profiles over a specified period
- The average acuity level
- The number of assessments at each acuity level
- The percentage of assessment at each level
Running the Acuity Summary Report
Complete the following steps to run the Acuity Summary report:
- From the Reports menu, select Acuity > Acuity Summary. This opens the selection criteria page.
- On the Selection Criteria tab, select one or more facilities from the Facilities section. Use CTRL+click to select multiple items. Use SHIFT+click to select a range of items. Staff Manager automatically limits the facilities to those set up for Acuity.
- Select one or more profiles from the Profiles section. Staff Manager automatically limits the profiles to those set up for Acuity.
-
Enter a start date in the box or click the calendar icon to use the date menu.
-
Enter an end date in the box or click the calendar icon to use the date menu.
- Select Include Assessment Details (Yes or No). If you select Yes, the report includes the following details for each assessment with the selected start and end dates.
- Location
- Service
- Assessor Name
- PID (Patient Identification Number)
- Date
- Time
- Acuity
- Select an Export Type.
- If you select PDF, Staff Manager opens the report results as a PDF.
- If you select Microsoft Office Excel, Staff Manager exports the report results as an Excel spreadsheet. You must have Microsoft Office Excel or Excel Viewer installed on your workstation to use this option.
- Click Run Report. If you selected the PDF export type, the report is displayed in the Report Output pane. If you selected the Excel export type, an alert window opens to let you select whether to open the report or to save the report as an Excel spreadsheet. It is recommended you users select Save so that you can review the report in Excel.
Be aware that report formatting is not retained when you export a report to Excel.
Viewing the Acuity Summary Report
This report summarizes acuity activity for selected profile or profiles over a selected period. If you selected to run the report without details, the report displays the following data.
- A graph charting the percent of patients at each acuity level
- The number of assessments made in the selected unit or units over a specified period
- The average acuity level
- The number of assessments at each acuity level
- The percentage of assessment at each level
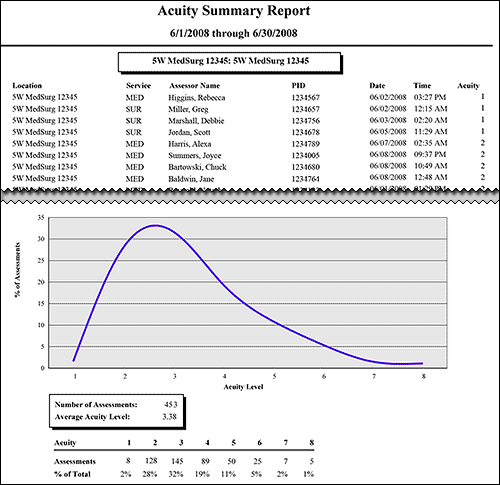
If you selected to include details in the report, then in addition to the data listed above, the report also displays the following information for each patient assessment during the selected start and end dates.
- Location: Includes each defined location within the selected profile or profiles
- Service: Hospital service as received from the registration interface or as edited based on customer specific rules
- Assessor Name: In Last Name, First Name format
- PID (Patient Identification Number): The patient’s encounter number
- Date: Date of the assessment
- Time: Time of the assessment
- Acuity: Calculated acuity level
Sample Report without Details

Sample Report with Details

 Related Topics


